
Example 1b: Waveform alignment#
In this example we align waveforms, which is a pre-requisite to measure relative amplitudes. Aligning the waveforms also includes finding filter optimal filter passbands for each seismic station and discarding data that is too noisy for analysis.
This notebook relies on the data previously created in the Example 1a.
Let us first import the modules we will need for this notebook and change into the muji/ directory. Let us then remember which ones were the reference MTs.
from IPython.display import Image, display # trick to show files in notebook
from relmt import io, main, core
from pathlib import Path
import shutil

# Change directory
%cd muji
/projects/restricted/relMT/relmt/src/relMT/examples/muji
# Show the reference MT file
! head data/reference_mts.txt
#Number            nn            ee            dd            ne            nd            ed
# (int)          (Nm)          (Nm)          (Nm)          (Nm)           (Nm)         (Nm)
   7508 -1.220000e+15  1.289000e+15 -6.900000e+13  1.414000e+15  5.480000e+14 -2.800000e+14
   7640 -8.670000e+15  1.648000e+16 -7.810000e+15  1.807000e+16  1.912000e+16  4.820000e+15
Screening the not-aligned data#
We will start by screening the data using relmt plot-alignment. It provides a powerful visualisation of the seimic traces. As we begin with the not-yet-aligned traces, we will need to deactivate a few features.
For example, to look at the P wave train of station EP02, we need to parse the file waveform array file muji/data/EP02_P-wvarr.npy. We here want to sort the events by magnitude, do not want to compute the cross-correlation matrix for now (which can be computationally expensive for large S-wave datasets), and highlight the reference events 7508 and 7640. On a command line, you can execute this command to get an interactive window:
relmt plot-alignment --sort magnitude --highlight 7508 7640 --cc none data/EP02_P-wvarr.npy
For this notebook, we write into a temporary file that we can display using the -s option.
! relmt plot-alignment --sort magnitude --cc none --highlight 7508 7640  -s tmp.png data/EP02_P-wvarr.npy
display(Image(filename='tmp.png'))
! rm tmp.png
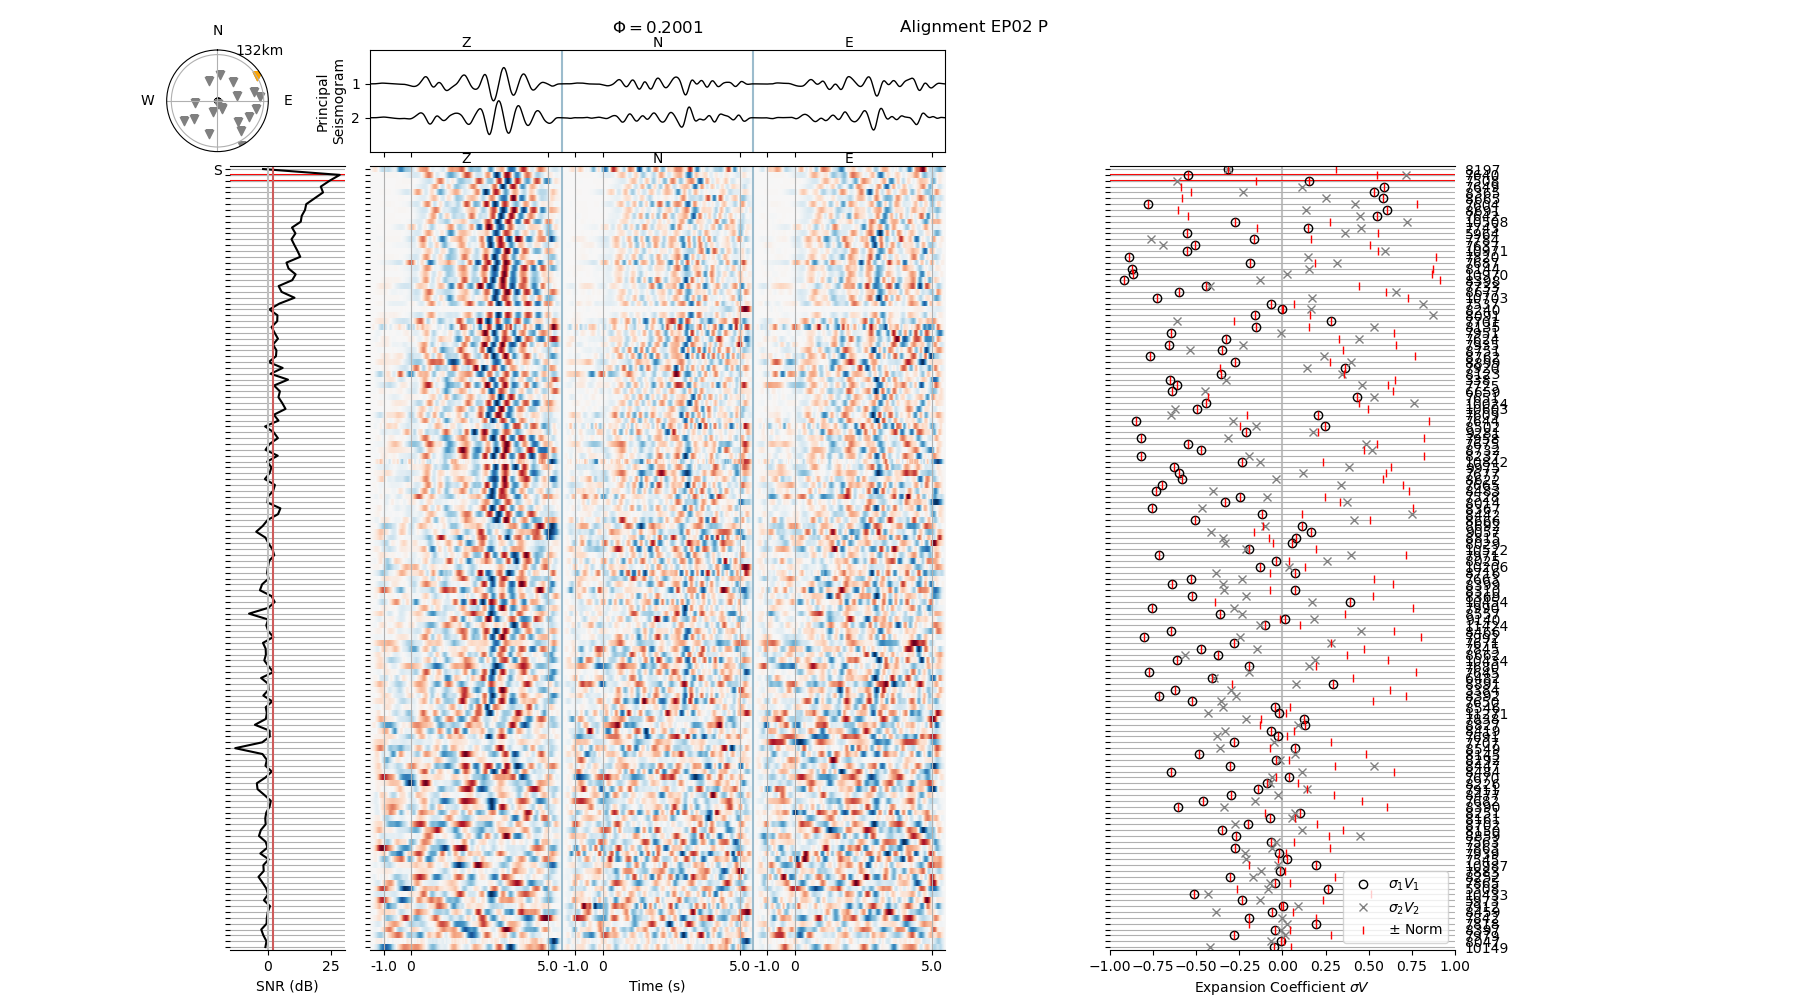
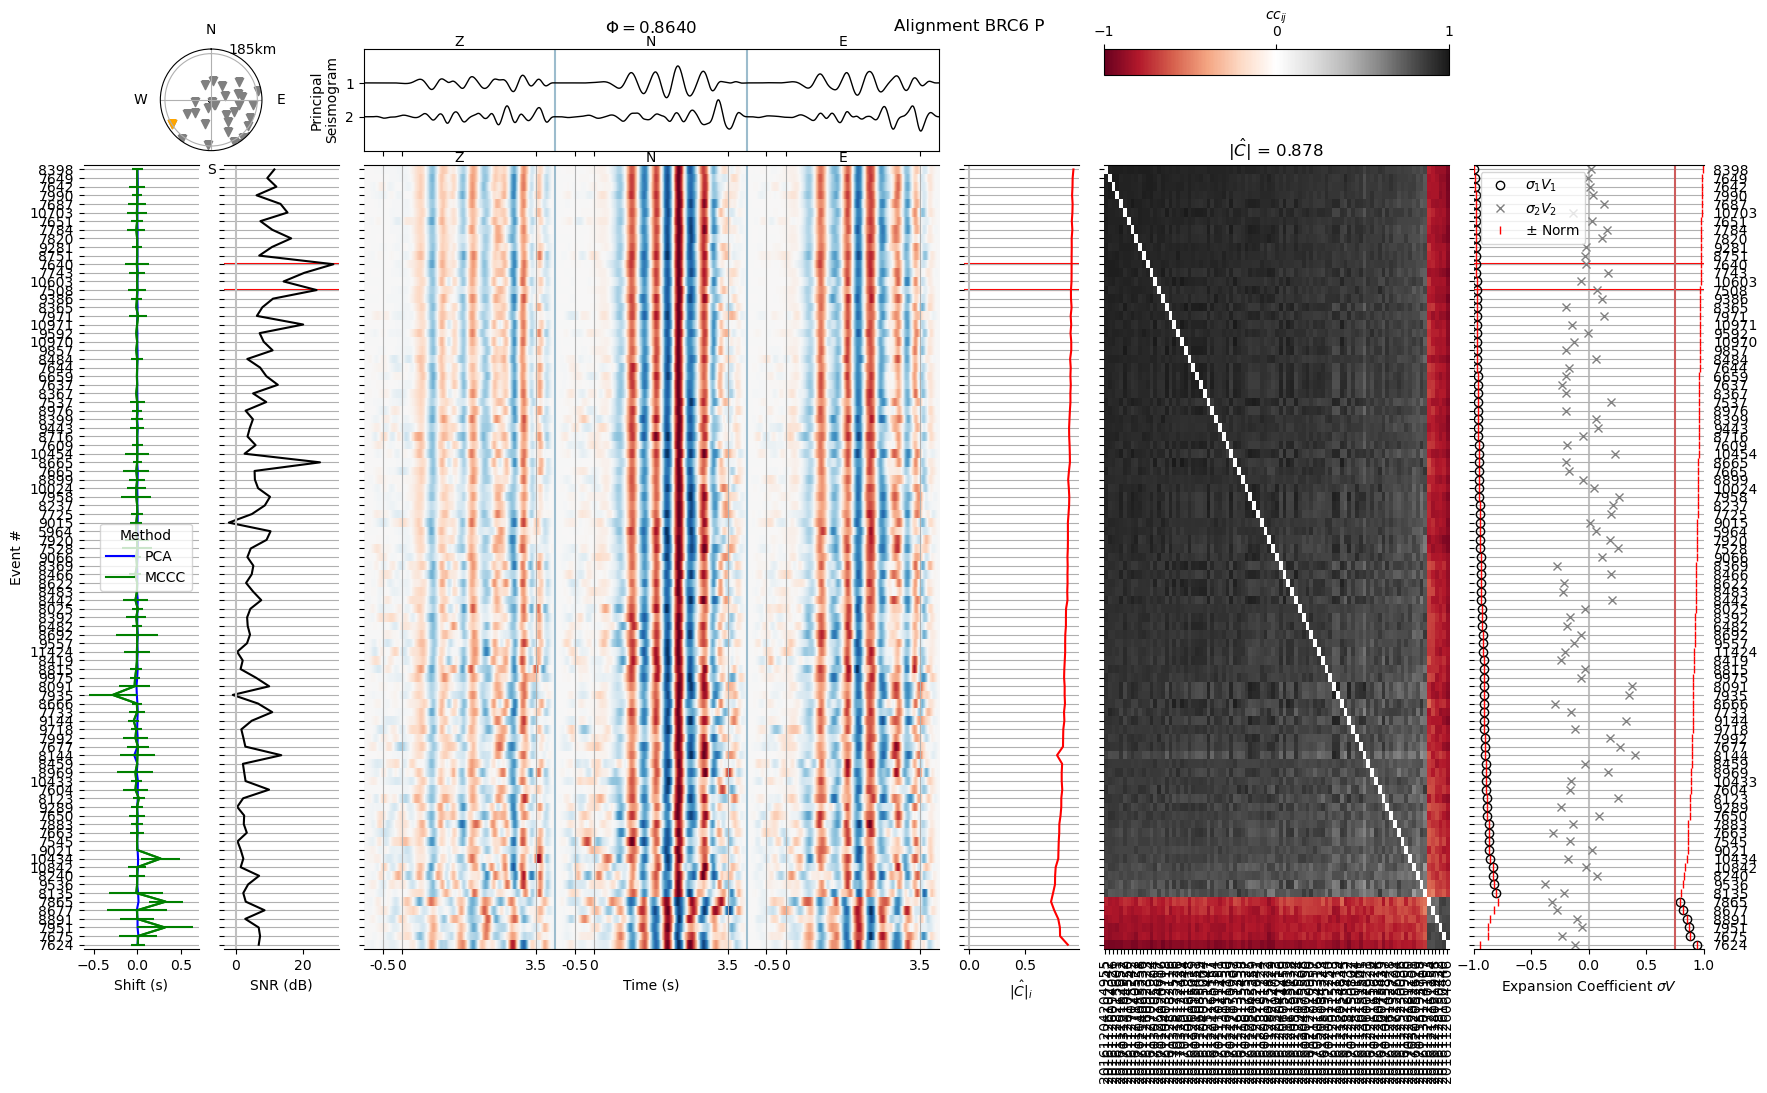
The center panel shows the waveform matrix. The three components (Z N E) are concatenated into a single trace. Only the time window between phase_start and phase_end plus the taper is shown and annotated at the bottom. The waveforms are filtered between the highpass and lowpass frequencies defined in the header file (here data/EP02_P-hdr.yaml). We see how the SNR (left panel) becomes lower with decreasing magnitude toward the bottom of the figure and how the waveforms are similar, but not yet well aligned. The original arrival time pick is located at time 0. Some traces with a rather poor SNR (\(\le\) 0 dB) do not show any signal at all.
The right-hand panel shows the expansion coefficient norm of each trace, a measure that becomes relevant later. The top center panel shows the first two principal components of the waveform matrix. The aim of the alignment procedure is to project as much energy as possible onto the first principal component, the principal seismogram.
Change parameters of a single waveform#
The signal to noise ratio depends on the time window designated as “signal” (controlled by the header parameters phase_start and phase_end) and the filter passband (controlled by highpass and lowpass). Let us change the parameters and observe the effect on the appearance of the waveform and the SNR.
Feel free to modify the header values as you please. In practice, we would edit the header file using a text editor and plot from the command line using the relmt plot-alignment method we used above.
# Select a waveform header file
hdrf = core.file("waveform_header", "EP02", "P")
print("Header file is: ", hdrf)

# Store the old header to restore later
shutil.copy(hdrf, str(hdrf) + ".backup")

# Read the header
hdr = io.read_header(hdrf)

# Print the values we are interested in
print("Old header values:")
for key in ["phase_start", "phase_end", "highpass", "lowpass"]:
    print(f"{key}: {hdr[key]}")

# Modify header
hdr["phase_start"] = 0.0
hdr["phase_end"] = 3.0
hdr["highpass"] = 1
hdr["lowpass"] = 10.0

# Print the values we are interested in
print("New header values:")
for key in ["phase_start", "phase_end", "highpass", "lowpass"]:
    print(f"{key}: {hdr[key]}")

# Save it to file
hdr.to_file(hdrf, overwrite=True)

# Read the default config and plot again.
# We here use the python entry point of relmt plot-alignment
config = io.read_config("config.yaml")
main.plot_alignment_entry(
    Path("data") / "EP02_P-wvarr.npy",
    config,
    sort="magnitude",
    highlight_events=[7508, 7640],
    cc_method="none",
    confirm=False,  # For interactivity
)
print("Figure drawn.")

# Restore old header
shutil.copy(str(hdrf) + ".backup", hdrf)
print("Old header restored.")
INFO : Configuration written to: data/EP02_P-hdr.yaml
Header file is:  data/EP02_P-hdr.yaml
Old header values:
phase_start: -1.0
phase_end: 5.0
highpass: 0.5
lowpass: 2.0
New header values:
phase_start: 0.0
phase_end: 3.0
highpass: 1.0
lowpass: 10.0
Figure drawn.
Old header restored.

Exclude traces by signal-noise-ratio#
We now exclude all events that have a SNR smaller than 2 dB. Let us first set this value in the default header and see what this would mean for all waveforms in the data set.
hdrf = core.file("waveform_header")
print("Default header file is: ", hdrf)

# We set the minimum SNR in the default header file for all waveforms
hdr = io.read_header(hdrf)
hdr["min_signal_noise_ratio"] = 2.0
hdr.to_file(hdrf, overwrite=True)

# Read the default config and plot again.
# We here use the python entry point of relmt plot-alignment
config = io.read_config("config.yaml")
INFO : Configuration written to: data/default-hdr.yaml
Default header file is: data/default-hdr.yaml
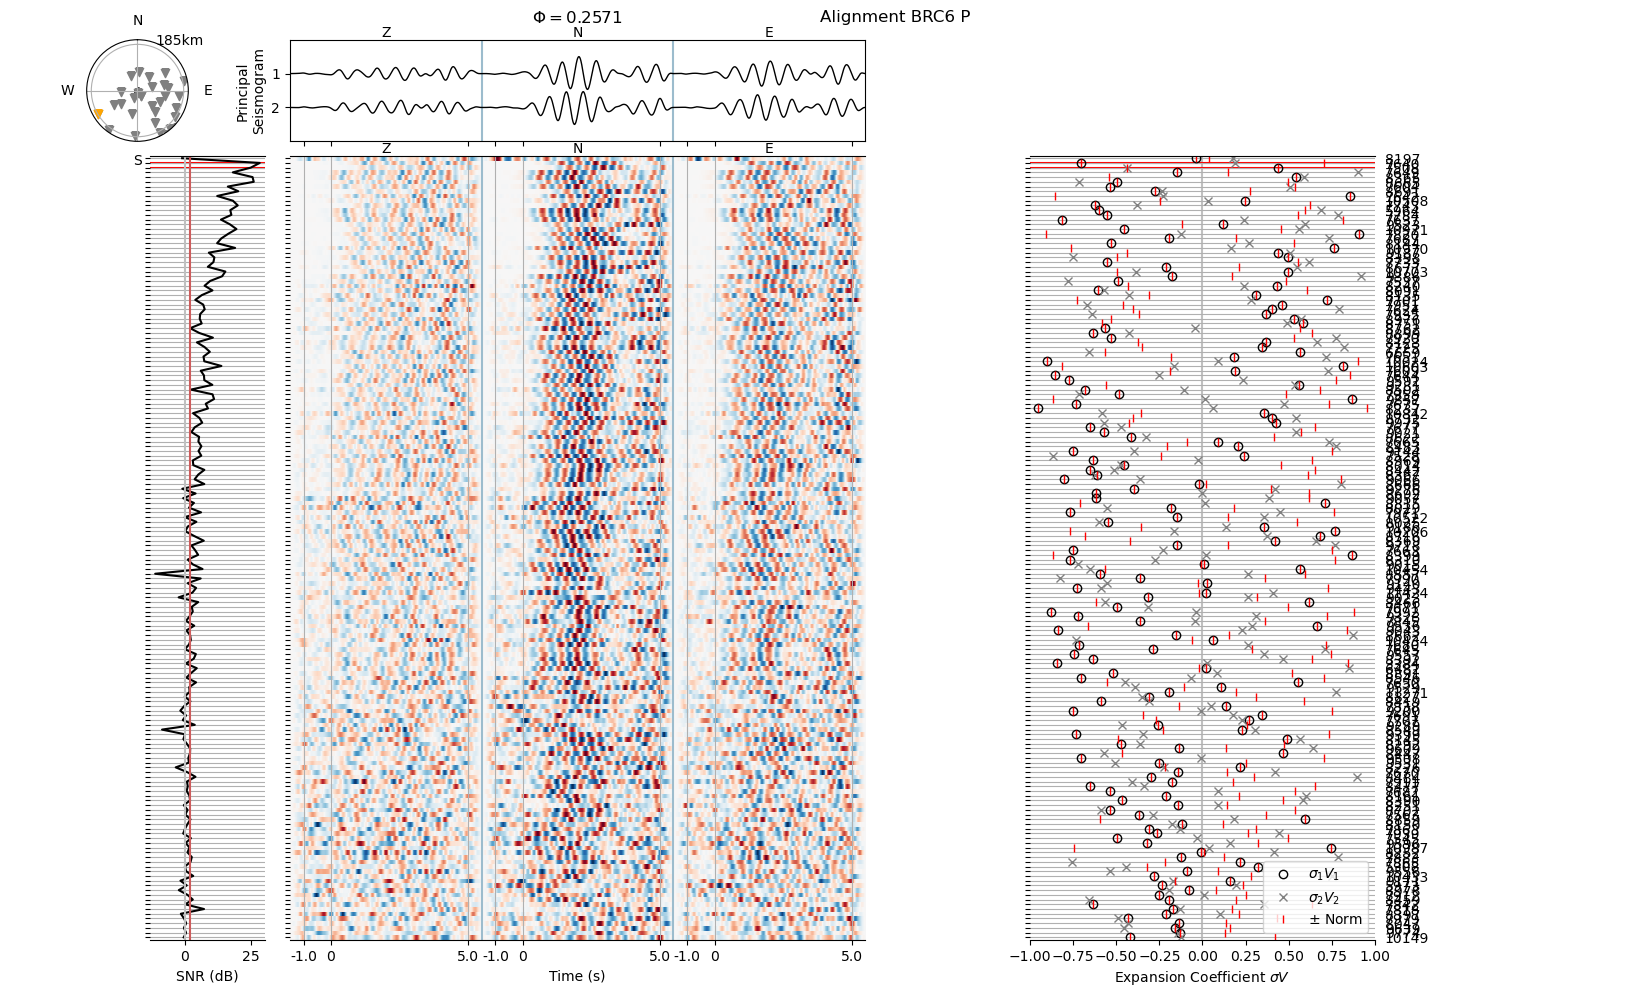
Execute the next cell various times, to plot all available stations one after another. In a shell, this is equivalent to:
for wvf in data/*-wvarr
do
relmt plot-alignment $wvf --sort magnitude --highight 7508 7640 --cc none
done
The red vertical line in the SNR panel (left) indicates the threshold below which events will be excluded.
# Execute this cell to re-set the iterator over all waveforms.
wvfs = iter(sorted(Path("data").glob("*-wvarr.npy")))
# Execute this cell repeatedly to look at all waveforms
try:
    wvf = next(wvfs)
except StopIteration:
    print("We reached the last file. Continue below.")

print("Plotting from file: ", wvf)
main.plot_alignment_entry(
    wvf,
    config,
    sort="magnitude",
    highlight_events=[7508, 7640],
    cc_method="none",
    confirm=False,
)
Plotting from file: data/BRC6_P-wvarr.npy
Let us exclude some data. As the logging output is set to “INFO” we will get some feedback from relMT about how many seismic traces were removed.
conf = io.read_config("config.yaml")
conf.to_file("config.yaml", overwrite=True)
INFO : Configuration written to: config.yaml
We use relmt exclude to exclude individual traces. The --snr flag means to exclude all data that have an SNR below the min_singal_noise_ratio value set in the waveform header file. The --nodata flag means to scan for traces that contain NaN values, or such that are all-zero (or all below the absolute null_data value set in the waveform header).
! relmt exclude --nodata --snr
INFO    : Reading excludes from: exclude.yaml
INFO    : Excluding 160 invalid traces
INFO    : Excluding 9852 traces due to high SNR
Aligning waveforms#
To align the waveforms, let us first set the required parameters in the configuration file. These are in fact only station_file and ncpu. In a terminal based workflow, we would simply edit the configuration file config.yaml in a text editor. Here, we load the file, edit the Config object and save it back to file.
conf = io.read_config("config.yaml")
conf["ncpu"] = 20  # Depends on your hardware requirements
conf.to_file("config.yaml", overwrite=True)
INFO : Configuration written to: config.yaml
To speed up computation, we will limit the combinations considered to align the waveforms by combining each event only with its 20 nearest neighbors. We here set a default value for all waveforms using the default header, but a separate value can be defined in each the waveform header files.
hdr = io.read_header("data/default-hdr.yaml")
hdr["combine_neighbors"] = 20  # Number of nearest neighboring events to combine
hdr.to_file("data/default-hdr.yaml", overwrite=True)
INFO : Configuration written to: data/default-hdr.yaml
We now align the waveforms. We here use only multi-channel cross-correlation (MCCC), which yields sample-accuracy. For this dataset, using 20 CPUs, alignment takes about 10 minutes. When using all event combinations the alignment would take about 3 1/2 hours on a compareable system.
! relmt align --mccc
INFO : Aligning with MCCC
INFO    : Found 7803 combinations for EP13_S

[output abbreviated]

INFO    : Found 55 combinations for EP15_P

[output abbreviated]

INFO    : Configuration written to: align1/EP10_S-hdr.yaml
Inspect pre-alignment results#
Station wavetrains were attempted to be aligned to the sample. The alignment results were written to the align1/ folder. Besides the waveform array files (ending in -wvarr.npy) and header files (ending in -hdr.yaml), we find cross-correlation and time shift tables (ending in -dt_cc.txt and -cc.txt).
! ls align1/

# Make a backup copy of all header files
for src in Path("align1").glob("*-hdr.yaml"):
    dst = str(src) + ".backup"
    shutil.copy(src, dst)
BRC6_P-cc.txt	  EP07_P-dt_cc.txt   EP15_P-hdr.yaml   EP25_S-wvarr.npy
BRC6_P-dt_cc.txt  EP07_P-hdr.yaml    EP15_P-wvarr.npy  EP27_P-cc.txt
BRC6_P-hdr.yaml   EP07_P-wvarr.npy   EP15_S-cc.txt     EP27_P-dt_cc.txt
BRC6_P-wvarr.npy  EP07_S-cc.txt      EP15_S-dt_cc.txt  EP27_P-hdr.yaml
BRC6_S-cc.txt	  EP07_S-dt_cc.txt   EP15_S-hdr.yaml   EP27_P-wvarr.npy
BRC6_S-dt_cc.txt  EP07_S-hdr.yaml    EP15_S-wvarr.npy  EP28_P-cc.txt
BRC6_S-hdr.yaml   EP07_S-wvarr.npy   EP16_P-cc.txt     EP28_P-dt_cc.txt
BRC6_S-wvarr.npy  EP08A_P-cc.txt     EP16_P-dt_cc.txt  EP28_P-hdr.yaml
CHE6_P-cc.txt	  EP08A_P-dt_cc.txt  EP16_P-hdr.yaml   EP28_P-wvarr.npy
CHE6_P-dt_cc.txt  EP08A_P-hdr.yaml   EP16_P-wvarr.npy  EP29_P-cc.txt
CHE6_P-hdr.yaml   EP08A_P-wvarr.npy  EP16_S-cc.txt     EP29_P-dt_cc.txt
CHE6_P-wvarr.npy  EP08_P-cc.txt      EP16_S-dt_cc.txt  EP29_P-hdr.yaml
CHE6_S-cc.txt	  EP08_P-dt_cc.txt   EP16_S-hdr.yaml   EP29_P-wvarr.npy
CHE6_S-dt_cc.txt  EP08_P-hdr.yaml    EP16_S-wvarr.npy  EP30_P-cc.txt
CHE6_S-hdr.yaml   EP08_P-wvarr.npy   EP18_P-cc.txt     EP30_P-dt_cc.txt
CHE6_S-wvarr.npy  EP08_S-cc.txt      EP18_P-dt_cc.txt  EP30_P-hdr.yaml
EP01_P-cc.txt	  EP08_S-dt_cc.txt   EP18_P-hdr.yaml   EP30_P-wvarr.npy
EP01_P-dt_cc.txt  EP08_S-hdr.yaml    EP18_P-wvarr.npy  ICE6_S-cc.txt
EP01_P-hdr.yaml   EP08_S-wvarr.npy   EP18_S-cc.txt     ICE6_S-dt_cc.txt
EP01_P-wvarr.npy  EP09_P-cc.txt      EP18_S-dt_cc.txt  ICE6_S-hdr.yaml
EP01_S-cc.txt	  EP09_P-dt_cc.txt   EP18_S-hdr.yaml   ICE6_S-wvarr.npy
EP01_S-dt_cc.txt  EP09_P-hdr.yaml    EP18_S-wvarr.npy  ISH6_P-cc.txt
EP01_S-hdr.yaml   EP09_P-wvarr.npy   EP19_P-cc.txt     ISH6_P-dt_cc.txt
EP01_S-wvarr.npy  EP09_S-cc.txt      EP19_P-dt_cc.txt  ISH6_P-hdr.yaml
EP02_P-cc.txt	  EP09_S-dt_cc.txt   EP19_P-hdr.yaml   ISH6_P-wvarr.npy
EP02_P-dt_cc.txt  EP09_S-hdr.yaml    EP19_P-wvarr.npy  LAN6_P-cc.txt
EP02_P-hdr.yaml   EP09_S-wvarr.npy   EP19_S-cc.txt     LAN6_P-dt_cc.txt
EP02_P-wvarr.npy  EP10_P-cc.txt      EP19_S-dt_cc.txt  LAN6_P-hdr.yaml
EP02_S-cc.txt	  EP10_P-dt_cc.txt   EP19_S-hdr.yaml   LAN6_P-wvarr.npy
EP02_S-dt_cc.txt  EP10_P-hdr.yaml    EP19_S-wvarr.npy  LAN6_S-cc.txt
EP02_S-hdr.yaml   EP10_P-wvarr.npy   EP20_P-cc.txt     LAN6_S-dt_cc.txt
EP02_S-wvarr.npy  EP10_S-cc.txt      EP20_P-dt_cc.txt  LAN6_S-hdr.yaml
EP03_P-cc.txt	  EP10_S-dt_cc.txt   EP20_P-hdr.yaml   LAN6_S-wvarr.npy
EP03_P-dt_cc.txt  EP10_S-hdr.yaml    EP20_P-wvarr.npy  P116_P-cc.txt
EP03_P-hdr.yaml   EP10_S-wvarr.npy   EP21_P-cc.txt     P116_P-dt_cc.txt
EP03_P-wvarr.npy  EP11_P-cc.txt      EP21_P-dt_cc.txt  P116_P-hdr.yaml
EP03_S-cc.txt	  EP11_P-dt_cc.txt   EP21_P-hdr.yaml   P116_P-wvarr.npy
EP03_S-dt_cc.txt  EP11_P-hdr.yaml    EP21_P-wvarr.npy  P116_S-cc.txt
EP03_S-hdr.yaml   EP11_P-wvarr.npy   EP21_S-cc.txt     P116_S-dt_cc.txt
EP03_S-wvarr.npy  EP11_S-cc.txt      EP21_S-dt_cc.txt  P116_S-hdr.yaml
EP04_P-cc.txt	  EP11_S-dt_cc.txt   EP21_S-hdr.yaml   P116_S-wvarr.npy
EP04_P-dt_cc.txt  EP11_S-hdr.yaml    EP21_S-wvarr.npy  P146_P-cc.txt
EP04_P-hdr.yaml   EP11_S-wvarr.npy   EP22_P-cc.txt     P146_P-dt_cc.txt
EP04_P-wvarr.npy  EP12_P-cc.txt      EP22_P-dt_cc.txt  P146_P-hdr.yaml
EP04_S-cc.txt	  EP12_P-dt_cc.txt   EP22_P-hdr.yaml   P146_P-wvarr.npy
EP04_S-dt_cc.txt  EP12_P-hdr.yaml    EP22_P-wvarr.npy  P146_S-cc.txt
EP04_S-hdr.yaml   EP12_P-wvarr.npy   EP22_S-cc.txt     P146_S-dt_cc.txt
EP04_S-wvarr.npy  EP13_P-cc.txt      EP22_S-dt_cc.txt  P146_S-hdr.yaml
EP05_P-cc.txt	  EP13_P-dt_cc.txt   EP22_S-hdr.yaml   P146_S-wvarr.npy
EP05_P-dt_cc.txt  EP13_P-hdr.yaml    EP22_S-wvarr.npy  P236_P-cc.txt
EP05_P-hdr.yaml   EP13_P-wvarr.npy   EP24_P-cc.txt     P236_P-dt_cc.txt
EP05_P-wvarr.npy  EP13_S-cc.txt      EP24_P-dt_cc.txt  P236_P-hdr.yaml
EP05_S-cc.txt	  EP13_S-dt_cc.txt   EP24_P-hdr.yaml   P236_P-wvarr.npy
EP05_S-dt_cc.txt  EP13_S-hdr.yaml    EP24_P-wvarr.npy  P236_S-cc.txt
EP05_S-hdr.yaml   EP13_S-wvarr.npy   EP24_S-cc.txt     P236_S-dt_cc.txt
EP05_S-wvarr.npy  EP14_P-cc.txt      EP24_S-dt_cc.txt  P236_S-hdr.yaml
EP06_P-cc.txt	  EP14_P-dt_cc.txt   EP24_S-hdr.yaml   P236_S-wvarr.npy
EP06_P-dt_cc.txt  EP14_P-hdr.yaml    EP24_S-wvarr.npy  SUM6_P-cc.txt
EP06_P-hdr.yaml   EP14_P-wvarr.npy   EP25_P-cc.txt     SUM6_P-dt_cc.txt
EP06_P-wvarr.npy  EP14_S-cc.txt      EP25_P-dt_cc.txt  SUM6_P-hdr.yaml
EP06_S-cc.txt	  EP14_S-dt_cc.txt   EP25_P-hdr.yaml   SUM6_P-wvarr.npy
EP06_S-dt_cc.txt  EP14_S-hdr.yaml    EP25_P-wvarr.npy  SUM6_S-cc.txt
EP06_S-hdr.yaml   EP14_S-wvarr.npy   EP25_S-cc.txt     SUM6_S-dt_cc.txt
EP06_S-wvarr.npy  EP15_P-cc.txt      EP25_S-dt_cc.txt  SUM6_S-hdr.yaml
EP07_P-cc.txt	  EP15_P-dt_cc.txt   EP25_S-hdr.yaml   SUM6_S-wvarr.npy
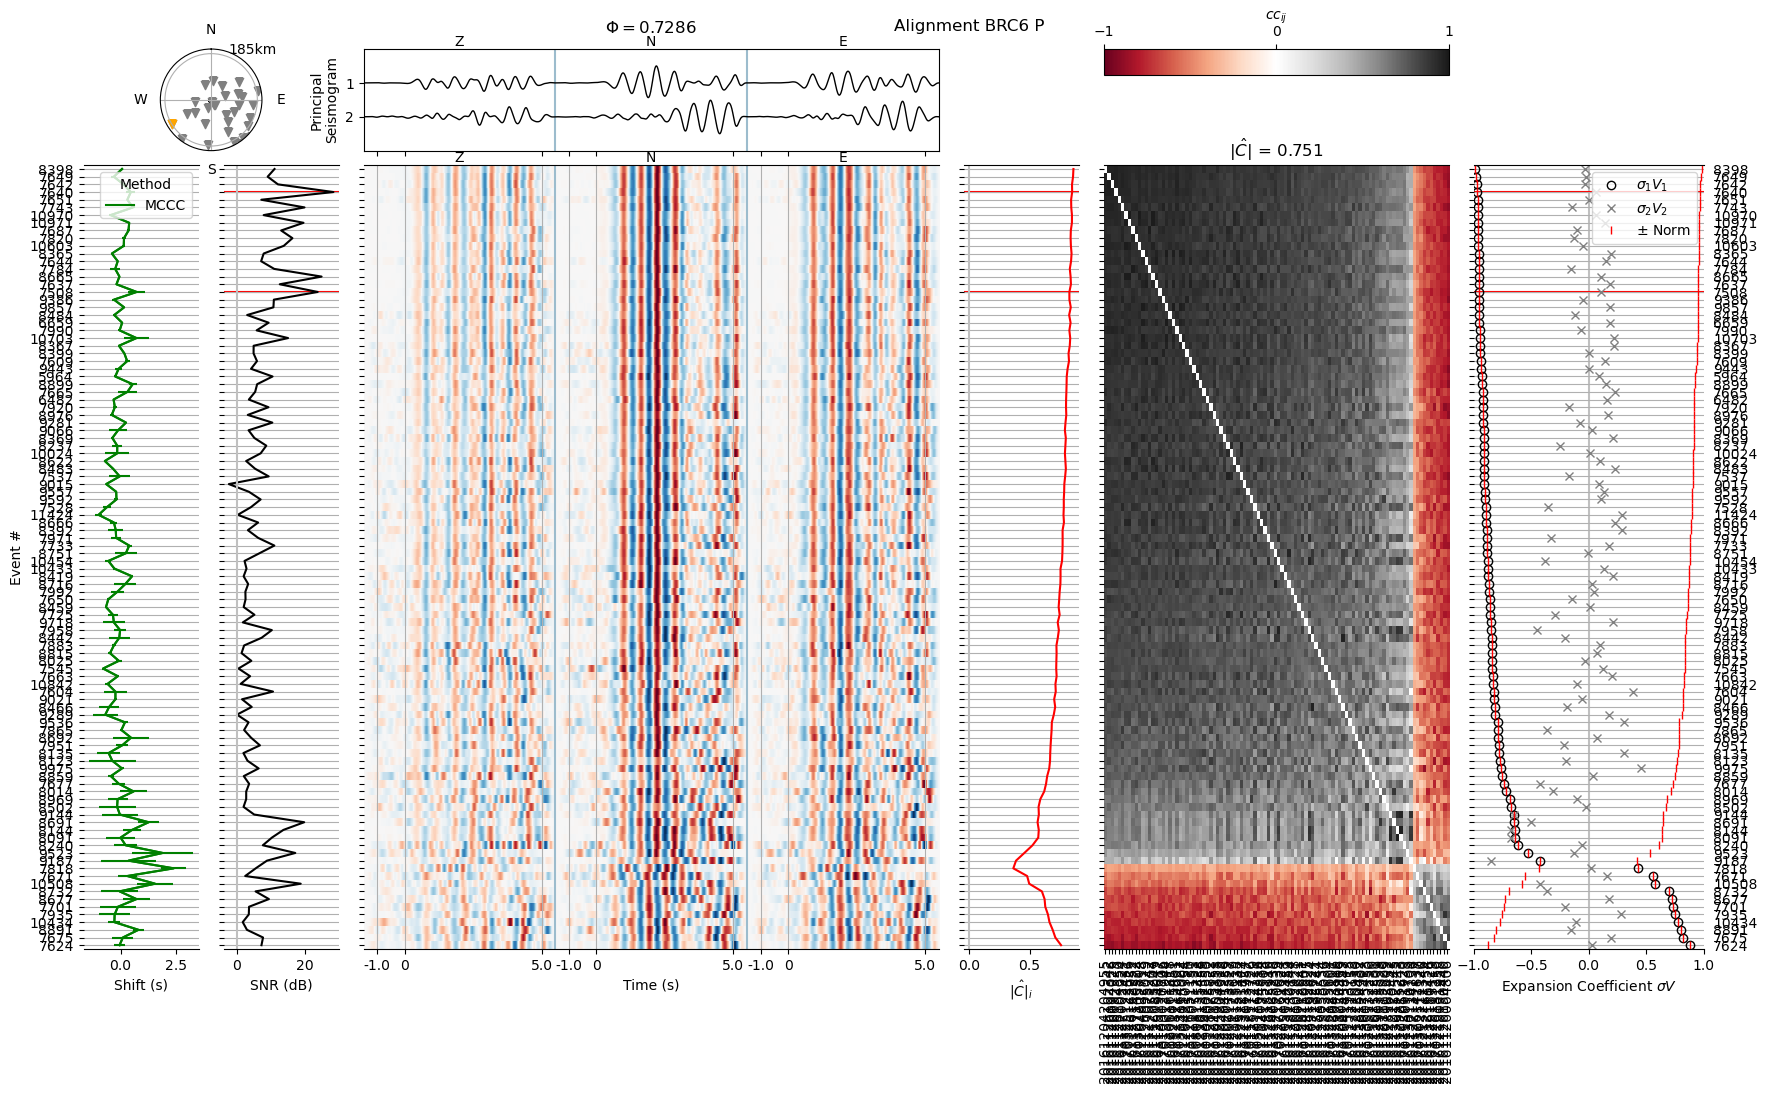
Let’s have a look how the alignment went. relmt plot-alignment now provides richer output, as cross-correlation values and time shifts have been computed. We will define the some additional processing parameters that will be displayed for acknowledgement while skimming through the waveforms.
In practice we would make an interactive alignment plot for each waveform and decide on waveform exclusion or refined parameters from looking at these plots.
for wvf in align1/*-wvarr.npy
do
relmt plot-alignment --highlight 7508 7640 --cc file $wvf
done
# Phases we will exclude, with reason
exclude_wvid = {
    "EP01_S": "Too few observations",
    "EP08_P": "too few observations",
    "EP08_S": "too few observations",
    "EP12_P": "too few observations",
    "EP12_S": "too few observations",
    "EP13_P": "a complex waveform at Pn/Pg crossing",
    "EP13_S": "a complex waveform at Sn/Sg crossing",
    "EP15_S": "a waveform too noisy and complex",
    "EP16_S": "a waveform too noisy",
    "EP18_S": "too few observations",
    "EP19_P": "too few and complex waveforms",
    "EP19_S": "too few and complex waveforms",
    "EP20_P": "too few and complex waveforms",
    "EP21_S": "too complex waveforms",
    "EP22_P": "too few observations and very distant",
    "EP24_P": "too few observations and very distant",
    "EP24_S": "too few observations and very distant",
    "EP25_P": "too complex observations and very distant",
    "EP27_P": "too few observations and very distant",
    "EP28_P": "too complex observations and very distant",
    "EP29_P": "too complex observations and very distant",
    "ICE6_P": "too few observations",
    "ICE6_S": "too few observations",
    "ISH6_P": "too few, distant and complex observations",
    "LAN6_P": "too complex observations, very distant",
    "LAN6_S": "too few observations, very distant",
    "P146_P": "too few observations",
    "P146_S": "too few observations",
}

# Time windows we will adapt
new_phase_start_end = {
    "BRC6_P": (-0.5, 3.5),
    "BRC6_S": (0.5, 4),
    "CHE6_P": (0, 3),
    "CHE6_S": (-0.5, 3.5),
    "EP02_S": (0.5, 5.0),
    "EP03_P": (0, 4),
    "EP03_S": (0.5, 5),
    "EP04_P": (0, 4),
    "EP04_S": (-0.5, 4),
    "EP05_P": (-1, 4),
    "EP05_S": (-1, 4),
    "EP06_S": (2, 5.5),
    "EP07_P": (-1, 4.0),
    "EP09_P": (-1.5, 2),
    "EP09_S": (-1, 4),
    "EP10_S": (-1, 4),
    "EP14_P": (-1, 4),
    "EP14_P": (0, 5),
    "EP16_P": (-1.5, 3.5),
    "EP21_P": (-1.5, 3.5),
    "P116_P": (-1, 4.0),
}

# Expansion coefficient norm exclusion criterion we will apply
ecn_threshold = {
    "BRC6_P": 0.8,
    "BRC6_S": 0.7,
    "CHE6_P": 0.5,
    "CHE6_S": 0.7,
    "EP02_P": 0.7,
    "EP03_P": 0.6,
    "EP04_P": 0.6,
    "EP06_P": 0.6,
    "EP06_S": 0.5,
    "EP07_P": 0.5,
    "EP07_S": 0.5,
    "EP08A_P": 0.6,
    "EP09_P": 0.5,
    "EP10_P": 0.8,
    "EP11_P": 0.55,
    "EP11_P": 0.6,
    "EP14_P": 0.5,
    "EP14_S": 0.6,
    "EP14_P": 0.81,
    "EP16_P": 0.7,
    "EP18_P": 0.7,
    "EP21_P": 0.7,
    "EP30_P": 0.8,
    "P116_P": 0.6,
    "P116_S": 0.6,
    "P236_P": 0.6,
    "P236_S": 0.6,
    "SUM6_P": 0.6,
}
Quality control of the alignment#
We will next plot the waveforms and quality metrics as they were returned from the first alignment iteration, one after another. Additionally, we will provide some rationale for why a waveform had been excluded, how a phase window was changed, or which threshold for exclusion of individual events was applied.
We will load the exclude file and append the excluded waveform IDs to the waveform list. In practice, this could be done by editing the exclude.yaml file.
# Iterator over all waveforms
wvfs = iter(sorted(Path("align1").glob("*-wvarr.npy")))

config = io.read_config("config.yaml")
config["loglevel"] = "WARNING"  # Don't clutter print output below
exclude = io.read_exclude_files("exclude.yaml")

# Let's again combine only the 20 nearest neighboring events
hdr = core.Header()
hdr["combine_neighbors"] = 20

# Save it to the default header file in align1/.
hdrf = core.file("waveform_header", n_align=1)
hdr.to_file(hdrf, True)

print("Default header values written to: ", hdrf)
Default header values written to: align1/default-hdr.yaml
Execute the next cell various times to repeat plotting the waveforms. When you loose interest, execute the cell following after to fast-foward application of all header values and exclusion entries.
wvf = next(wvfs)

print("Plotting from file: ", wvf)

# Identify waveid from filename. Open corresponding header
wvid = wvf.stem.split("-wvarr")[0]
sta, pha = core.split_waveid(wvid)
hdrf = core.file("waveform_header", sta, pha, 1)
hdr = io.read_header(hdrf)

after = "and after "
if wvid in exclude_wvid:
    print(f"This waveform ({wvid}) should be excluded, because of {exclude_wvid[wvid]}")
    after = ""

    # Only append if not already present
    if wvid not in exclude["waveform"]:
        exclude["waveform"] += [wvid]

if wvid in new_phase_start_end:
    start, end= new_phase_start_end[wvid]
    print(f"We will set a new phase window, from {start} to {end} seconds")
    hdr["phase_start"] = start
    hdr["phase_end"] = end

if wvid in ecn_threshold:
    ecn = ecn_threshold[wvid]
    print(f"Waveforms below an ECN of {ecn} appear too noisy or ambiguous and will be excluded")
    hdr["min_expansion_coefficient_norm"] = ecn

print(f"Before {after}editing the header:")
main.plot_alignment_entry(
    wvf,
    config,
    highlight_events=[7508, 7640],
    cc_method="file",
    confirm=False,
)

hdr.to_file(hdrf, True)

if wvid not in exclude_wvid:
    main.plot_alignment_entry(
        wvf,
        config,
        highlight_events=[7508, 7640],
        cc_method="file",
        confirm=False,
    )
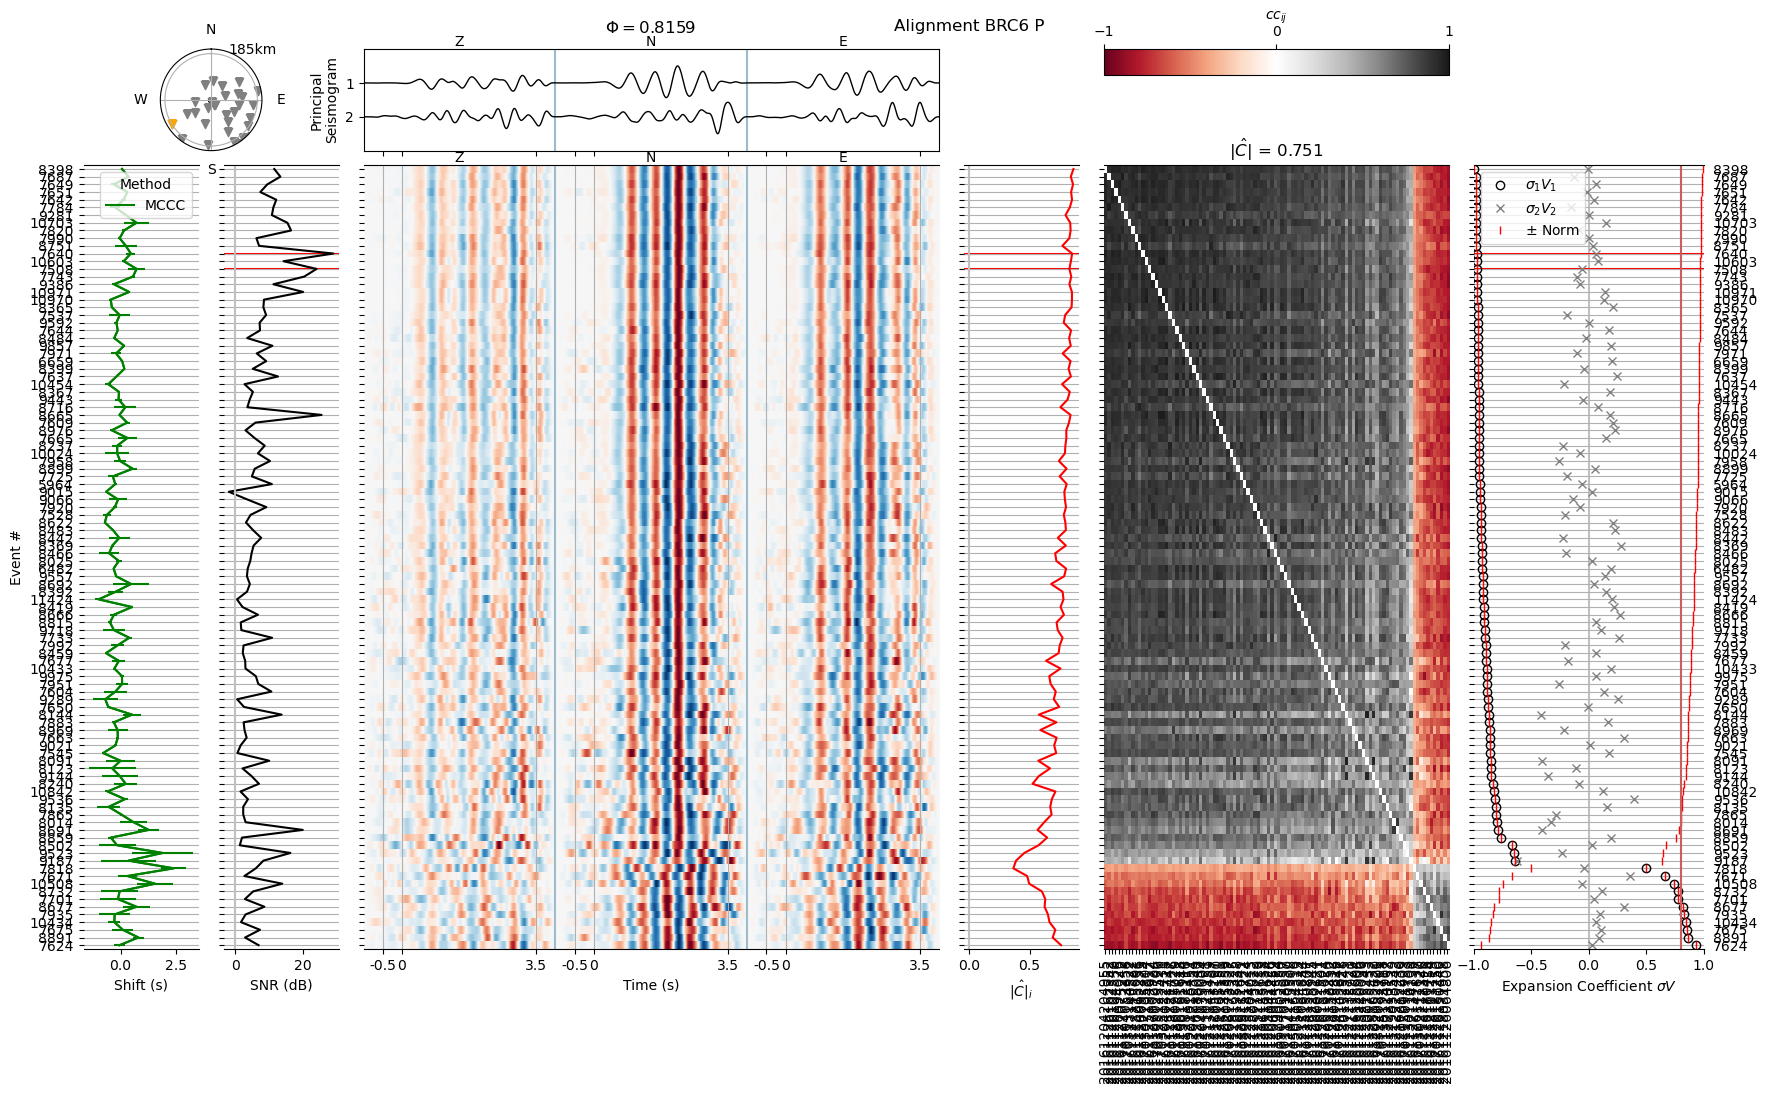
Plotting from file:  align1/BRC6_P-wvarr.npy
We will set a new phase window, from -0.5 to 3.5 seconds
Waveforms below an ECN of 0.8 appear too noisy or ambiguous and will be excluded
Before and after editing the header:
# Go through the rest of the iterator and apply all changes
for wvf in wvfs:
    wvid = wvf.stem.split("-wvarr")[0]
    sta, pha = core.split_waveid(wvid)
    hdrf = core.file("waveform_header", sta, pha, 1)
    hdr = io.read_header(hdrf)

    if wvid in exclude_wvid and wvid not in exclude["waveform"]:
        exclude["waveform"] += [wvid]

    if wvid in new_phase_start_end:
        start, end= new_phase_start_end[wvid]
        hdr["phase_start"] = start
        hdr["phase_end"] = end

    if wvid in ecn_threshold:
        ecn = ecn_threshold[wvid]
        hdr["min_expansion_coefficient_norm"] = ecn

    hdr.to_file(hdrf, True)

io.save_yaml("exclude.yaml", exclude)

# Set log level back to Info
config["loglevel"] = "INFO"
config.to_file("config.yaml", True)
INFO : Configuration written to: config.yaml
Add bad traces to the exlusion file#
We will once more add traces to the exclusion file. This time, we exclude based on the expansion coefficient norm, which is the fraction by which each seismogram is represented by the principal seismogram (seismograms for S waves), using the --ecn flag.
To keep track of which waveforms were excluded at which step, and probably play with different exclusion parameters, we write the list of excluded waveforms to a separate file, exclude-ecn.yaml.
We also specify, that we read from alignment iteration 1 using the -a 1 flag.
! relmt exclude -a 1 --ecn --file exclude-ecn.yaml
INFO    : Reading previous excludes from: exclude-ecn.yaml
WARNING : Exclude file not found: exclude-ecn.yaml
INFO    : Nothing to exclude, yet.
INFO    : Excluding 608 traces due to low ECN
Now that we have an additional exclude file, we must not forget to add it to the list of used exclude files in the configuration
conf = io.read_config("config.yaml")
conf["exclude_files"] += ["exclude-ecn.yaml"]

print(f"Exclude files are: {conf['exclude_files']}")

conf.to_file("config.yaml", overwrite=True)
INFO    : Configuration written to: config.yaml
Exclude files are: ['exclude.yaml', 'exclude-ecn.yaml']
Re-align the wavefoms#
We are now readu to re-align the waveforms. As there might be cases of cycle-skipping, we apply both the MCCC and the PCA method. This is the default. We are reading from the first alignment iteration and must therefore parse the -a 1 flag. This command runs about 6 minutes on 20 cores.
! relmt align -a 1
INFO : Aligning with MCCC and PCA
INFO    : Found 950 combinations for EP03_P

[output abbreviated]

INFO    : Found 427 combinations for EP18_P

[output abbreviated]

INFO    : Configuration written to: align2/EP10_S-hdr.yaml
Confirm that all waveforms are well-aligned#
We go once more through all station waveforms and confirm that they are well aligned. Some event waveforms are still too poor to yield a reliable amplitude estimate.
We exclude those by defining a global minimum expansion coefficient norm threshold of 0.75 in the default headers. Event waveforms that have a lower value will be excluded from further processing. Some station waveforms exhibit unclear waveforms or show signs of cycle skipping that cannot be resolved. We exclude those manually from further processing.
exclude_wvid = {
    "BRC6_S": "unresolvable cycle skipping",
    "EP02_S": "unresolvable cycle skipping",
    "EP15_S": "no clear waveform pattern",
    "EP16_S": "no clear waveform pattern",
    "EP18_S": "unclear and few waveforms",
    "EP19_S": "no clear waveform pattern",
    "EP21_S": "no clear waveform pattern",
    "EP25_P": "no clear waveform pattern",
    "ISH6_P": "no waveform in window",
    "LAN6_P": "unresolvable cycle skipping",
    "P146_P": "too poor data",
    "P146_S": "too poor data",
}

# Set one trace exclusion criterion for all files
hdr = core.Header()
hdr["min_expansion_coefficient_norm"] = 0.75

hdrf = core.file("waveform_header", n_align=2)
hdr.to_file(hdrf, True)
INFO : Configuration written to: align2/default-hdr.yaml
# Iterator over all waveforms
wvfs = iter(sorted(Path("align2").glob("*-wvarr.npy")))
# Go through the stations
try:
    wvf = next(wvfs)
    wvid = wvf.stem.split("-wvarr")[0]

    print("Plotting from file: ", wvf)

    if wvid in exclude_wvid:
        print(f"! Excluding waveform, due to {exclude_wvid[wvid]}!")

    main.plot_alignment_entry(
        wvf,
        config,
        sort="pci",
        highlight_events=[7508, 7640],
        cc_method="file",
        confirm=False,
    )

except StopIteration:
    print("Went through all files.")
    print("Please continue below or execute previous cell to restart.")
Plotting from file: align2/BRC6_P-wvarr.npy
We now discard the waveforms we deemed unreliable and exclude the waveforms that do not fulfill the ecn > 0.75 quality criterion.
# Append excluded waveforms to exclusion file
exclude = io.read_exclude_files("exclude.yaml")
exclude["waveform"] = sorted(set(exclude["waveform"]).union(exclude_wvid.keys()))
io.save_yaml("exclude.yaml", exclude)
! relmt exclude -a 2 --ecn --overwrite --file exclude-ecn.yaml
INFO    : Reading excludes from: exclude-ecn.yaml
INFO    : Excluding 591 traces due to low ECN
Conclusion#
In this example we aligned P and S waveforms in two steps. The aligned wave are stored in the align2/ subfolder. We can go ahead an measure relative amplitudes on them.